Anyone use wxtide? I found it after looking for a graphical tides/currents interface. It's free -- and using NOAA tidal harmonics. It looks to be accurate when I crossreference with the NOAA tides and currents page.
I like it a lot -- easy to download and easy to use. (I have no commercial interest/connection with it -- I'm just too cheap to pay for something that is easily available -- and based on data and algorythyms supported by our tax dollars).
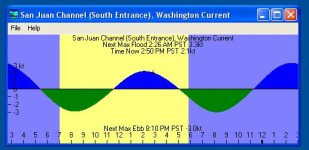
Once loaded it will open to a simple graph for whichever site you last viewed -- either tide or current. The sample below is the current graph for the South Entrance San Juan Channel. You might see the small + sign on the graph at 3:00 pm (it's hard to see and should be bigger) -- that's the time I took the snapshot of the graph.

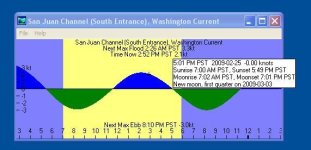
If you click anywhere on the graph it gives you the current prediction for that time:

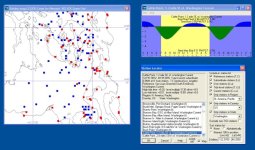
The best part of it, though, is the graphical map location finder that allows you to view a geographic region (using the mouse buttons to navigate), and select the current or tide location you want (the NOAA site requires that you know the location of all the sites and select from a menu -- this is much faster. Red for tide and blue for current (you can also view only currents or only tides)
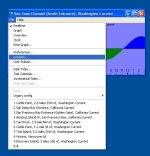
Click file, then location:

This is what comes up:

It's great for planning -- so next time I'll avoid the screaming ebb in Baynes Channel. A lot easier than trying to see tomorrows slack on my GPS software. Course... as the wxtide website says... always check your final current/tide data at the noaa site:
http://tidesandcurrents.noaa.gov/curren ... d2.html#OR
Anyone using something that may also be worth examining? Wxtide seems to work well for west coast sites I've explored -- I assume it works across north America.
As I said, I have no commercial interest in it -- just the one I came upon that seems to work well. Pretty simple program.
Matt
I like it a lot -- easy to download and easy to use. (I have no commercial interest/connection with it -- I'm just too cheap to pay for something that is easily available -- and based on data and algorythyms supported by our tax dollars).
Once loaded it will open to a simple graph for whichever site you last viewed -- either tide or current. The sample below is the current graph for the South Entrance San Juan Channel. You might see the small + sign on the graph at 3:00 pm (it's hard to see and should be bigger) -- that's the time I took the snapshot of the graph.

If you click anywhere on the graph it gives you the current prediction for that time:

The best part of it, though, is the graphical map location finder that allows you to view a geographic region (using the mouse buttons to navigate), and select the current or tide location you want (the NOAA site requires that you know the location of all the sites and select from a menu -- this is much faster. Red for tide and blue for current (you can also view only currents or only tides)
Click file, then location:

This is what comes up:

It's great for planning -- so next time I'll avoid the screaming ebb in Baynes Channel. A lot easier than trying to see tomorrows slack on my GPS software. Course... as the wxtide website says... always check your final current/tide data at the noaa site:
http://tidesandcurrents.noaa.gov/curren ... d2.html#OR
Anyone using something that may also be worth examining? Wxtide seems to work well for west coast sites I've explored -- I assume it works across north America.
As I said, I have no commercial interest in it -- just the one I came upon that seems to work well. Pretty simple program.
Matt
